

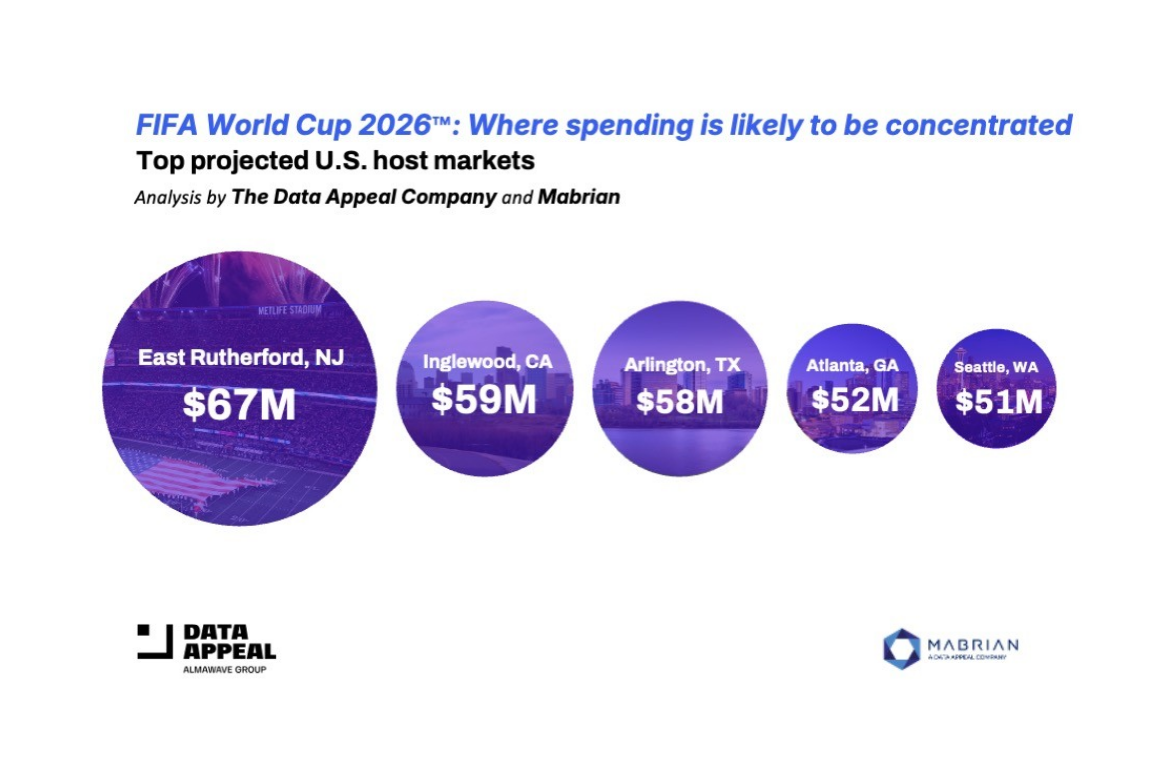
Pre-event data indicates FIFA World Cup 2026 spending in U.S. host cities will cluster where attendance, stadium capacity, hospitality, and air access align, though demand remains fluid as team qualifications finalize.
Florence (Italy), February 17, 2026 – A new pre-event economic impact analysis by The Data Appeal Company and Mabrian, both part of Almawave Group, projects that matches hosted in the United States during the FIFA World Cup 2026™ will generate $556 million in total event-related visitor spending—so far roughly 60% of the projected impact of a major global event such as the 2024 Olympic Games in Paris, based on a separate Data Appeal and Mabrian study of Olympic host cities.

Spending is expected to be highly concentrated in a number of major U.S host cities, with the top five destinations accounting for 52% of total projected spending. East Rutherford, New Jersey, leads the ranking with $67M, followed by Inglewood, CA ($59M), Arlington, TX ($58M), Atlanta, GA ($52M), and Seattle, WA ($51M).
East Rutherford’s leading position may reflect a combination of factors, including a large-capacity stadium, a higher concentration of scheduled matches, and proximity to the New York metropolitan area.
Together, these elements position East Rutherford as the single largest beneficiary among U.S. host locations, accounting for approximately 12% of total projected event-related spending.
The analysis indicates that the economic impact of the tournament is driven primarily by destination-based visitor spending.
“Food & beverage represents the largest spending category, projected at $280M, accounting for 50% of total spend—a distribution broadly consistent with patterns observed across other large-scale international sporting event,” said Mirko Lalli, CEO and Founder of The Data Appeal Company.
Food & beverage represents the largest spending category, followed by Accommodation at $181M (32.5%) and Transportation at $95M (17%), highlighting the importance of in-destination consumption and visitor dwell time.
Daily projections further reinforce that attendance volume is the strongest driver of spending. Variations in total spend reflect differences in match volume and scheduling, rather than differences in individual match profile, with all fixtures generating broadly comparable spending dynamics at the destination level. However, predictability remains limited where participating teams are not yet confirmed.
Qualification uncertainty continues to shape current demand patterns. With several qualifying tournaments still unresolved as of early February 2026, many fans appear to be delaying travel decisions until participating teams are confirmed.
While this analysis focuses on U.S. host city spending, broader tournament dynamics will be shaped by travel flows across all three host countries.
Based on current air scheduling between the 34 countries qualified for the FIFA World Cup and the host markets, the United States remains the only host country with direct connectivity from all qualified markets, increasing its seat capacity by +3.3% year over year. Mexico has direct air connections with 15 of them, followed by Canada with 12 (up +3.4% year over year).
Looking at overall capacity trends from competing countries for January 2026, Mabrian data shows that Mexico leads seat capacity growth among the three host countries, reaching +4.3% year over year.
According to Carlos Cendra, Director of Marketing and Communications at Mabrian, “Air scheduling for 2026 is still at a very early stage and will continue to evolve. Frequencies and capacity will be adjusted as the tournament approaches, while the playoff matches determining the final two qualified teams—scheduled for late March in Guadalajara and Monterrey—will further influence air connectivity patterns.”
Download the full pre-event findings: www.datappeal.io/free-pre-event-FIFA
Frequently Asked Questions (FAQs)
1. What is the projected economic impact of FIFA World Cup 2026 in the U.S.?
The analysis estimates that FIFA World Cup 2026 will generate approximately $556 million in event-related visitor spending across U.S. host cities.
2. Which U.S. host city is expected to generate the highest visitor spending?
East Rutherford, New Jersey, is projected to lead with $67 million in visitor spending, thanks to its stadium capacity, match schedule, and proximity to New York City.
3. Which spending category is expected to contribute the most during FIFA World Cup 2026?
Food and beverage is expected to account for the largest share of visitor spending at $280 million, followed by accommodation and transportation.
4. Why are some host cities expected to attract more spending than others?
Factors such as stadium capacity, number of matches, visitor attendance, hospitality infrastructure, and air connectivity are expected to influence spending across host cities.
5. How does air connectivity affect FIFA World Cup 2026 tourism?
Strong international air connections make it easier for fans to travel to host cities. The United States currently has direct connectivity with all qualified FIFA World Cup countries, supporting higher visitor demand.
6. Which countries are hosting the FIFA World Cup 2026?
The United States, Canada, and Mexico are jointly hosting the FIFA World Cup 2026, making it the first tournament to be hosted by three countries.
7. Why is visitor spending expected to change before the tournament begins?
Travel demand remains fluid because several teams had not yet qualified at the time of the analysis. Many fans are expected to finalize travel plans once all participating teams are confirmed.
8. Why is FIFA World Cup 2026 important for the travel and hospitality industry?
The tournament is expected to boost tourism, hotel occupancy, restaurants, transportation services, and local businesses, creating significant economic opportunities across host destinations.